Factbook At a Glance
Factbook At A Glance is a collection of our most commonly used charts. More in-depth information for these and other charts can be found in our full Factbook, which has been published annually since 2005. A brief summary of quick facts and figures is also available.
View the supporting data tables.
Trends of Admissions Summary
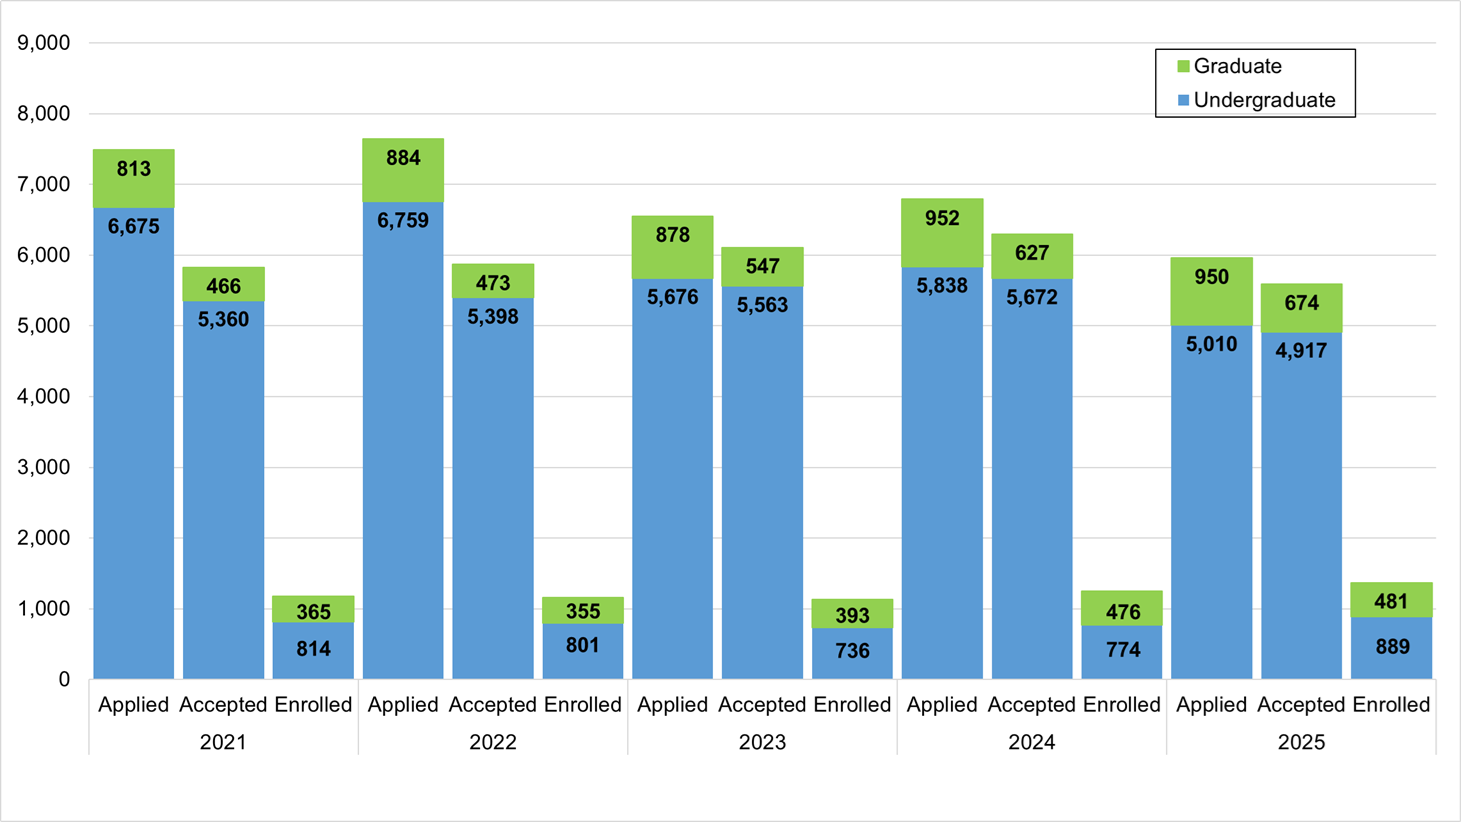
Note: Beginning in Fall 2023, the count of 'Applied' reported is now calculated as total admits plus denied applications, and no longer includes partially complete or withdrawn applications.
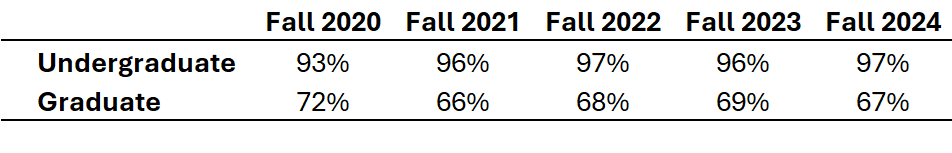
Percent of Students Receiving Financial Aid (reporting fall numbers only)
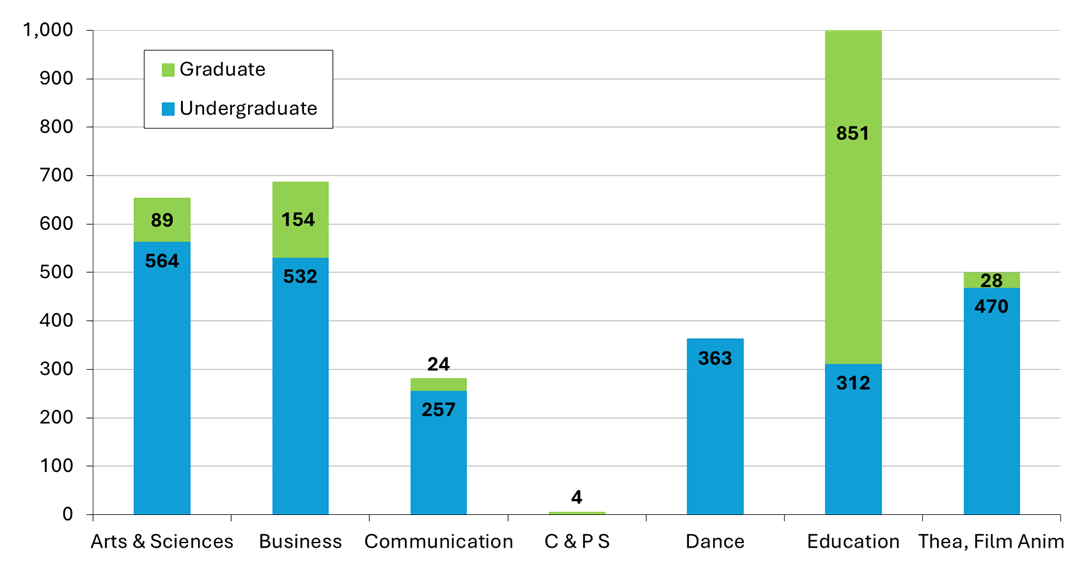
Enrollment by Academic School, Fall 2025
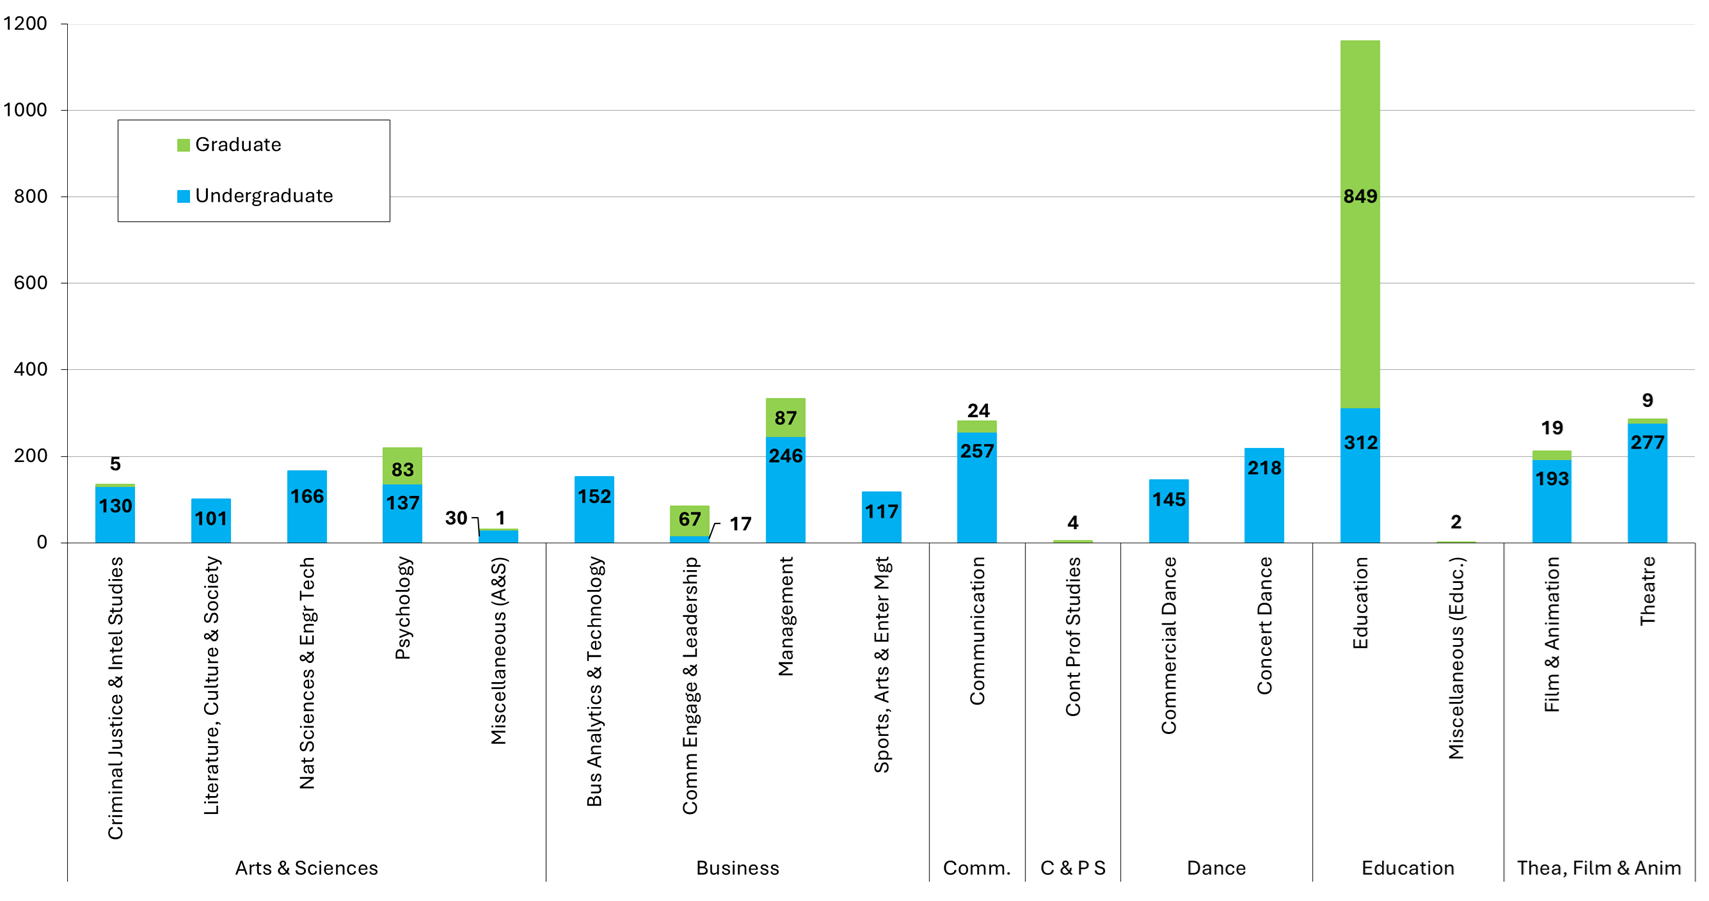
Enrollment by Academic Department, Fall 2025
Student Enrollment Trends 2021-2025
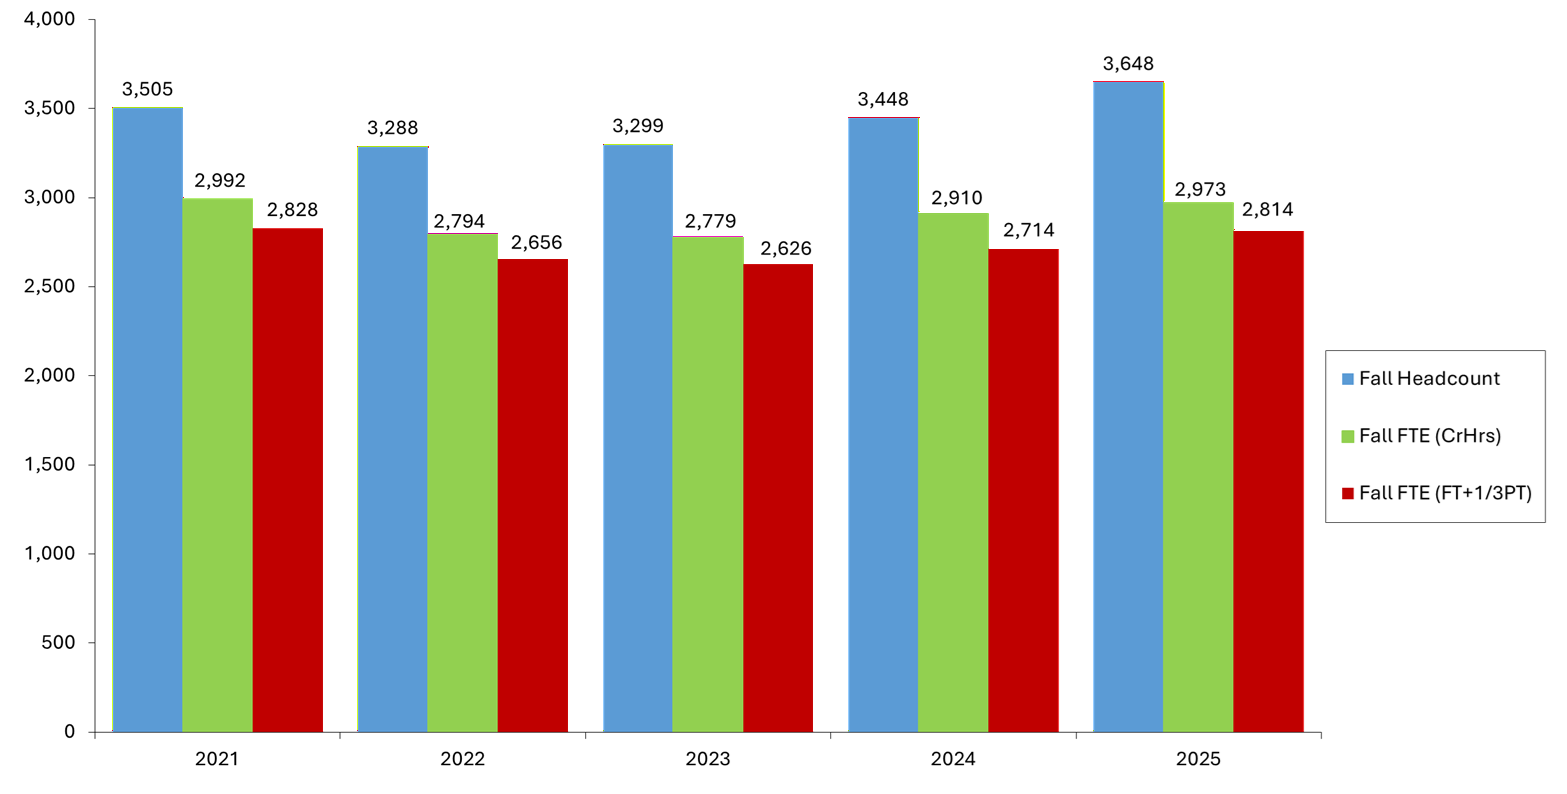
Enrollment Definitions
- Student enrollment is described in terms of both headcount and FTE (Full-time Equivalence)
- Student headcount is the count of individuals registered as of the census date.
- Student FTE is calculated using two different methods:
Method 1:
- Undergraduate FTE = Full-Time headcount + (Part-Time Credit Hours/15)
- Graduate FTE = Full-Time headcount + (Part-Time Credit Hours/10)
Method 2: Undergraduate and Graduate FTE = Full-Time headcount + (1/3 Part-Time headcount)
- Full-time Status – A student is classified as full-time if they maintain at least 12 undergraduate credits or 9 graduate credits.
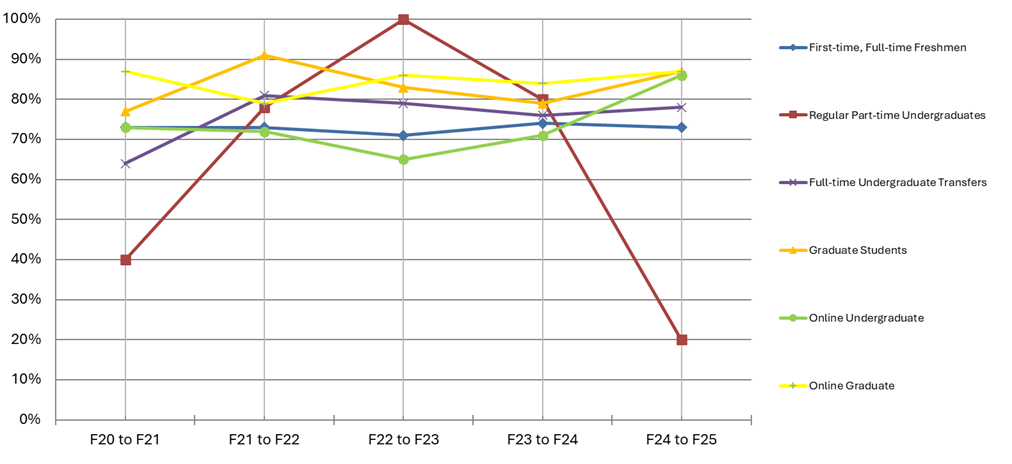
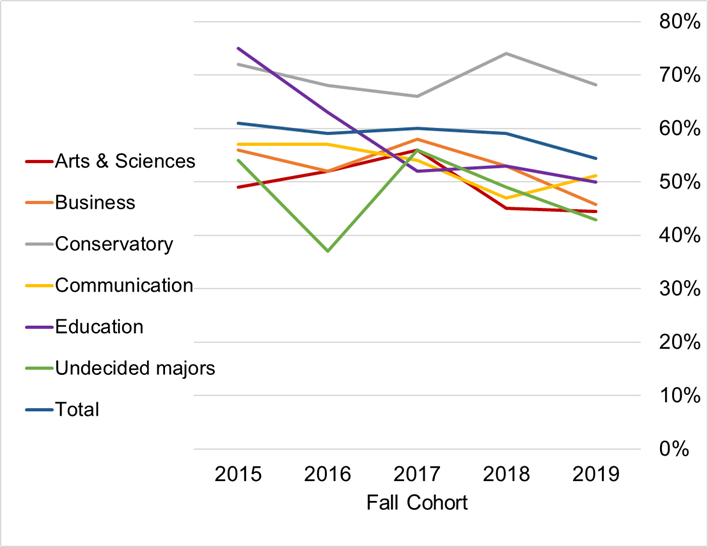
Fall to Fall Retention Rates of New Students by Student Type
Four-Year Graduation Rates (of first-time, full-time freshmen)
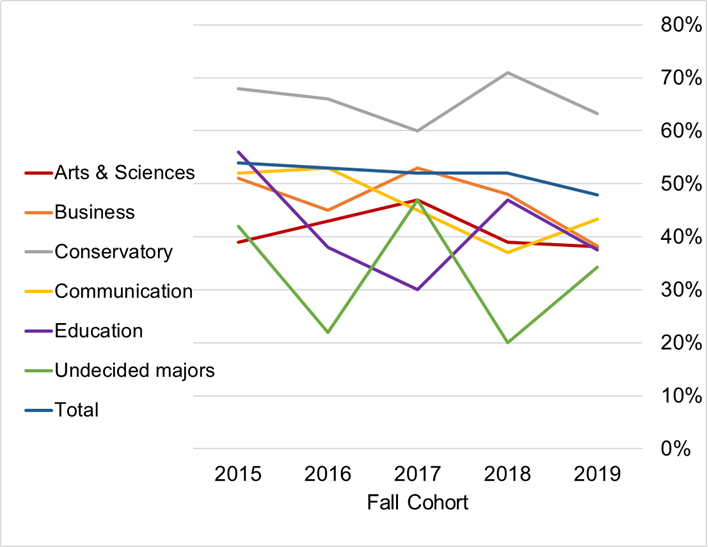
Six-Year Graduation Rates (of first-time, full-time freshmen)
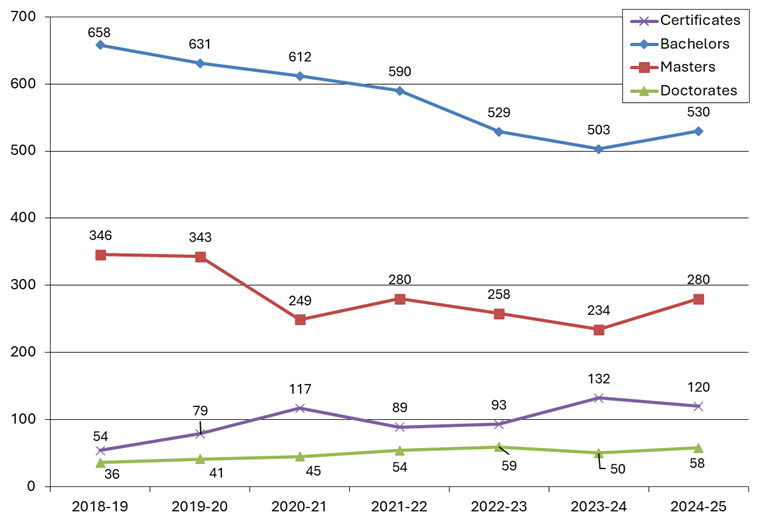
Trends in Degrees Conferred